pacman::p_load(readxl, gifski, gapminder,
plotly, gganimate, tidyverse)Hands-on Exercise 3b
Getting Started
Install and launching R packages
The code chunk below uses p_load() of pacman package to check if readxl, gifski, gapminder, plotly, gganimate and tidyverse packages are installed in the computer. If they are, then they will be launched into R.
Importing the data
col <- c("Country", "Continent")
globalPop <- read_xls("data/GlobalPopulation.xls",
                      sheet="Data") %>%
  mutate_each_(funs(factor(.)), col) %>%
  mutate(Year = as.integer(Year))
Warning: `mutate_each_()` was deprecated in dplyr 0.7.0.
ℹ Please use `across()` instead.Warning: `funs()` was deprecated in dplyr 0.8.0.
ℹ Please use a list of either functions or lambdas:
# Simple named list: list(mean = mean, median = median)
# Auto named with `tibble::lst()`: tibble::lst(mean, median)
# Using lambdas list(~ mean(., trim = .2), ~ median(., na.rm = TRUE))Animated Data Visualisation: gganimate methods
A static bubble plot is drawn below using ggplot2. This may not be that useful.
Code
ggplot(globalPop, aes(x = Old, y = Young,
                      size = Population,
                      colour = Country)) +
  geom_point(alpha = 0.7,
             show.legend = FALSE) +
  scale_colour_manual(values = country_colors) +
  scale_size(range = c(2, 12)) +
  labs(title = 'Year: {frame_time}',
       x = '% Aged',
y = '% Young') 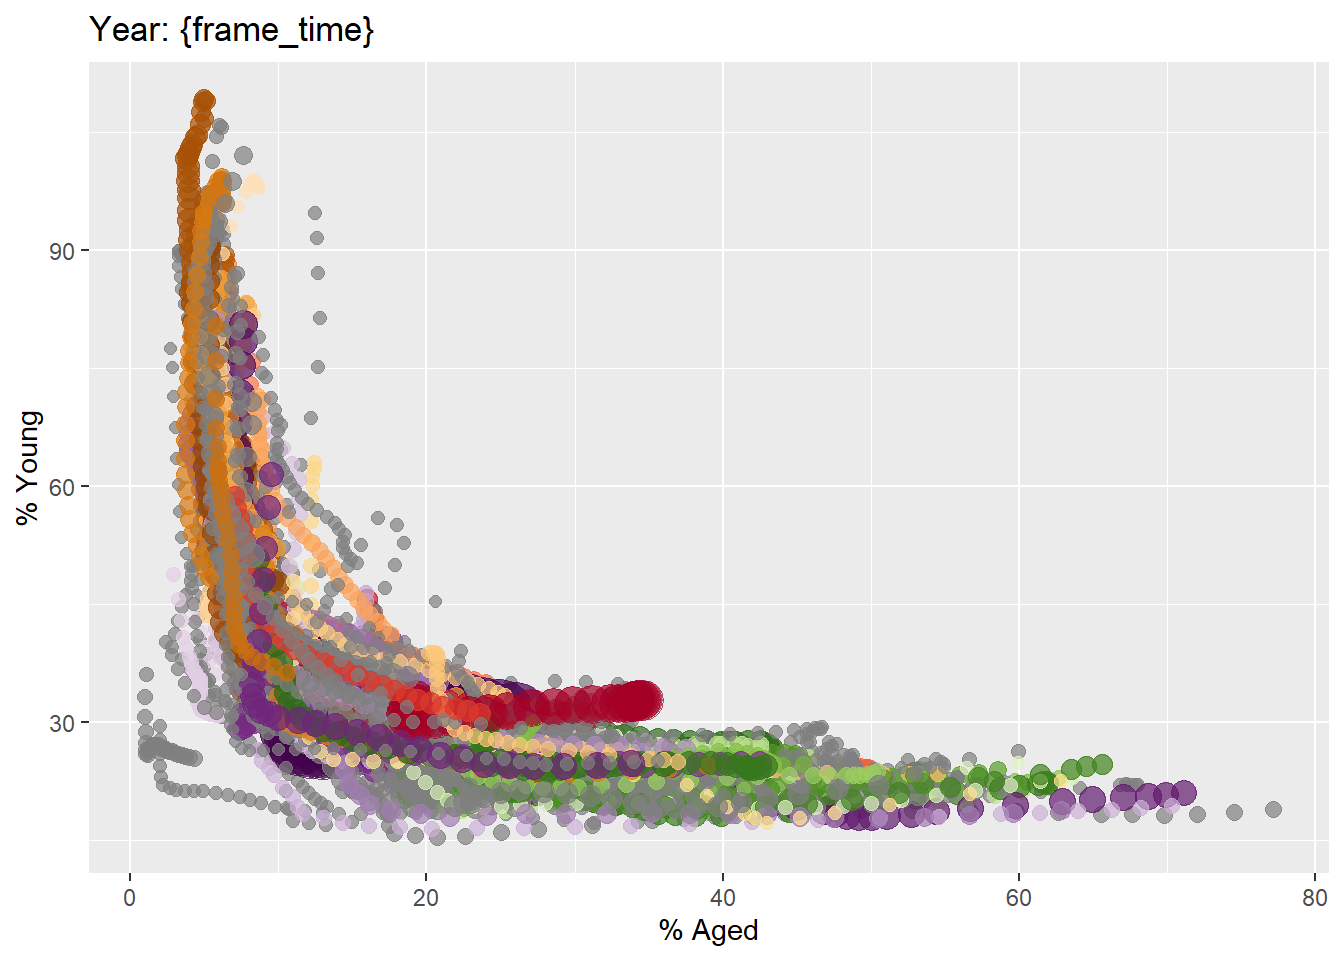
transition_time() of gganimate is used to create transition through distinct states.
Code
ggplot(globalPop, aes(x = Old, y = Young,
                      size = Population,
                      colour = Country)) +
  geom_point(alpha = 0.7,
             show.legend = FALSE) +
  scale_colour_manual(values = country_colors) +
  scale_size(range = c(2, 12)) +
  labs(title = 'Year: {frame_time}',
       x = '% Aged',
       y = '% Young') +
  transition_time(Year) +
ease_aes('linear') 
Animated Data Visualisation: plotly methods
With ggplotly
Code
gg <- ggplot(globalPop,
       aes(x = Old,
           y = Young,
           size = Population,
           colour = Country)) +
  geom_point(aes(size = Population,
                 frame = Year),
             alpha = 0.7,
             show.legend = FALSE) +
  scale_colour_manual(values = country_colors) +
  scale_size(range = c(2, 12)) +
  labs(x = '% Aged',
       y = '% Young')
Warning in geom_point(aes(size = Population, frame = Year), alpha = 0.7, :
Ignoring unknown aesthetics: frameCode
ggplotly(gg)Warning in p$x$data[firstFrame] <- p$x$frames[[1]]$data: number of items to
replace is not a multiple of replacement lengthWith plotly
Code
bp <- globalPop %>%
  plot_ly(x = ~Old,
          y = ~Young,
          size = ~Population,
          color = ~Continent,
          frame = ~Year,
          text = ~Country,
          hoverinfo = "text",
          type = 'scatter',
          mode = 'markers'
          )
bp